The Edit <line (figure) type> dialog box is opened by one of the following ways:
- Press the right mouse button on the selected trend line or the edge of the figure and select the Edit… menu item.
- Double click on the selected trend line or the edge of the figure.
View tab
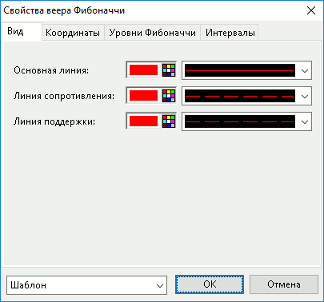
On the View tab the view of lines and figures is set up:
- Style – select color, style and width of the main line. It is specified for lines of Trend line, Horizontal line, Vertical line, Fibonacci time zones types.
- Extend to left – extend the line to the left making a half-line. It is specified for Trend lines;
- Extend to right – extend the line to the right making a half-line. It is specified for Trend lines;
- Always show the value on the price axis – show the trend value on the vertical axis. If the checkbox is disabled, then a value is shown on the vertical bar, only when the trend is selected. It is specified for Horizontal lines.
- Main line – select color, style and width of the main line. It is specified for lines of Fibonacci arc, Fibonacci fan, Fibonacci retracement, Speed lines types.
- Resistance line – select color, style and width of the resistance line. It is specified for lines of Fibonacci arc, Fibonacci fan, Fibonacci retracement, Speed lines, Channel types.
- Support line – select color, style and width of the support line. It is specified for lines of Fibonacci arc, Fibonacci fan, Fibonacci retracement, Speed lines, Channel types.
- Filling – select color and clearance level of the filling. It is specified for lines of Rectangle, Triangle, Ellipse types.
- Border – select color, style and width of the figure’s border. It is specified for lines of Rectangle, Triangle, Ellipse types.
- Build by counter trend – build by an opposite trend. It is specified for lines of Fibonacci fan type.
- Level marks – show the labels to the chart lines:
- on the left;
- on the right.
It is specified for lines of Fibonacci retracement type.
Color settings are described in Color settings.
Coordinates tab
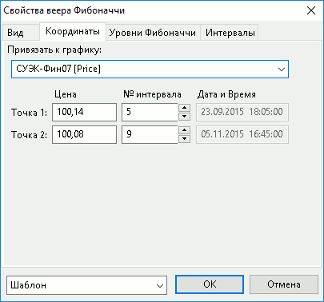
- Attach to – select the chart the trend line or figure is attached to.
- Coordinates of trend lines’ and figures’ grid points:
- Price: value on the vertical axis. For a rectangle it is displayed at lower and upper borders.
- Interval: number of the interval with the grid point.
- Date and Time: starting date and time of the interval with the grid point. If the spot is in the future time interval, then the box displays the number of shift intervals with a plus (+) sign, for example, +2. For a rectangle it is displayed at left and right borders. The box is not editable.
The number of grid points depends on the graph type:
- Horizontal line, Vertical line – one grid point.
- Trend line, Rectangle, Fibonacci arc, Fibonacci fan, Fibonacci retracement, Speed lines, Fibonacci time zones – two grid points.
- Ellipse, Triangle, Channel – three grid points.
Fibonacci levels tab
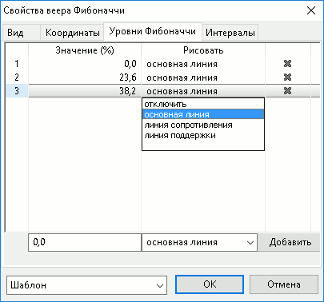
Fibonacci levels are set up on this tab. The tab is displayed in settings of Fibonacci arc, Fibonacci fan, Fibonacci level types.
- Value (%): level value;
- Draw line: select line:
- disabled: disable level displaying;
- main line;
- resistance line;
- support line.
Minimum level quantity: 1.
To add a new level change the level parameters in the lower window part and click OK.
To delete a level click on “X” on its right or disable its displaying and specify a zero value: levels with this parameters are deleted from the list automatically.
Levels tab
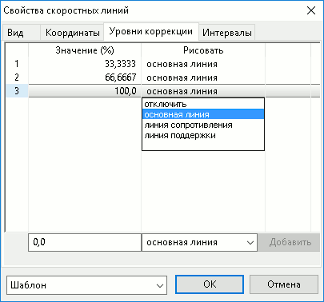
Correction levels are set up on this tab. The tab is displayed in settings of Speed lines.
- Value (%): level value;
- Draw line: select line:
- disabled: disable level displaying;
- main line;
- resistance line;
- support line.
Minimum level quantity: 3.
To add a new level change the level parameters in the lower window part and click OK.
To delete a level click on “X” on its right or disable its displaying and specify a zero value: levels with this parameters are deleted from the list automatically.
Intervals tab
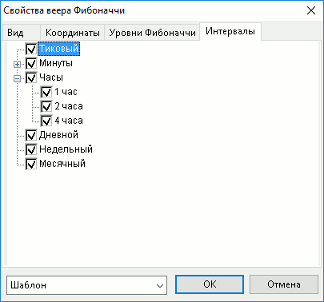
The visibility of the trend line or figure at different interval lengths is set up on the tab. Possible values:
- Tick;
- Minutes (from 1 to 6, 10, 15, 20, 30);
- Hours (1, 2, 4);
- Day;
- Weekly;
- Month.
Template
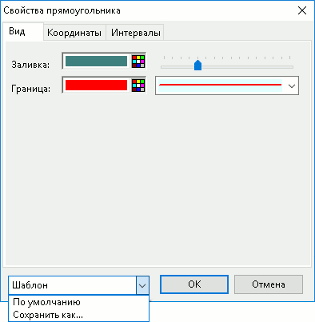
The trend line or figure template can be set up:
- Reset default – apply the default settings to a trend line or figure.
- Save as… – save the trend line or figure settings to a template. Specify the template name in the window that opens.
- <Template name> – apply the saved trend line or figure settings of the template to a figure. To delete a template from the list, use the X button located in the string with the template name.